Solar Panel Financing Options in the United States: A Comprehensive 2026 Market Analysis of Cost Structures and Regulatory Changes
Homeowners investigating solar panel financing options in the United States in 2026 face a significantly different economic landscape than in previous years due to major regulatory shifts. With the expiration of the primary federal residential solar tax credit on December 31, 2025, the methods used to fund these systems now require a deeper analysis of long-term return on investment and upfront capital requirements 14. This article examines the current structures for system acquisition, including direct ownership through cash or loans and third-party models such as leases and power purchase agreements.
The 2026 Regulatory Environment and the End of Section 25D
The primary driver of solar adoption for nearly two decades was the federal Residential Clean Energy Credit, known as Section 25D. Under the One Big Beautiful Bill Act (P.L. 119-21), this 30% credit was terminated for any residential property placed in service after December 31, 2025 26. This legislative change resulted in a 0% federal credit for owner-financed systems in 2026, effectively raising the net price of a customer-owned system by approximately 43% compared to the previous year 9. Consequently, financing models must now be evaluated based on their ability to compete directly with monthly utility rates without the cushion of a large federal tax refund.
Despite the end of the residential credit, the commercial Clean Electricity Investment Credit (Section 48E) remains active through the end of 2027 15. This provision allows companies that own solar assets to continue claiming a 30% credit. This distinction has caused a massive shift in the market back toward third-party ownership (TPO) models, as leasing companies can utilize the commercial credit and pass a portion of those savings to homeowners through lower monthly payments 11. Installers and financial institutions have had to restructure their offerings to ensure that monthly payments remain lower than local electricity bills to maintain consumer interest.
Cash Purchase Economics and Payback Periods
A cash purchase remains the most cost-effective long-term option for homeowners who have the liquid capital available. By paying for the system upfront, the owner avoids interest rates, dealer fees, and the escalators often found in third-party contracts 4. In 2026, the national average benchmark for solar installation is approximately $2.95 per watt 2. For a standard residential system, this typically translates to an investment between $15,000 and $30,000 depending on the size and location 1. While the upfront cost is high, cash-purchased systems provide the highest lifetime savings by eliminating all financing-related friction.
The removal of the federal credit has extended the typical payback period for cash-purchased systems. Before 2026, many systems achieved a break-even point in 6 to 9 years; however, current estimates suggest a payback window of 10 to 14 years in most states 18. The specific ROI depends heavily on state-level incentives, utility rebates, and local electricity rates. Homeowners in primary markets like New York, Florida, California, Arizona, and Colorado may see faster returns due to more favorable state policies and higher grid electricity costs 2.
Solar Loans and the Impact of Dealer Fees
Solar loans allow homeowners to achieve system ownership with manageable monthly payments, typically spread over 10 to 25 years 6. In 2026, personal loan APRs for solar projects generally range from 6.49% to 35.49%, depending on the lender and the borrower's credit profile 1. For example, specialized lenders may offer rates between 6.99% and 9.99%, but borrowers must remain vigilant regarding the total financed amount 4. A critical factor in 2026 is the presence of dealer fees, which are often buried within the financed total to offer a lower stated interest rate. These fees can range from 15% to 30% of the total system cost 9.
| Financing Method | Ownership Status | Average 2026 Cost/Rate | Key Financial Characteristic |
|---|---|---|---|
| Cash Purchase | Homeowner Owns | $2.50 to $3.80 per Watt | Highest ROI; No Interest |
| Solar Loan | Homeowner Owns | 6.49% to 35.49% APR | Includes potential dealer fees |
| Solar Lease | Third-Party Owns | Fixed Monthly Fee | Maintenance included by provider |
| PPA | Third-Party Owns | Rate per kWh Produced | No upfront cost; 30% credit via owner |
To avoid the dealer-fee trap, many financial analysts suggest considering home equity options, such as a cash-out refinance or a home equity loan. These traditional products typically do not carry the inflated fees associated with solar-specific lenders, allowing the homeowner to borrow against the actual system price rather than an artificially high one 9. Furthermore, loan-financed systems still contribute to an increase in home resale value, which national data indicates can be as high as 4% 13.
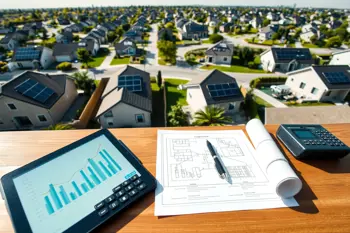
Leases, PPAs, and Third-Party Ownership Structures
Third-party ownership (TPO) through leases or Power Purchase Agreements (PPAs) has regained popularity in 2026 because these structures can still leverage the 30% commercial tax credit 7. In a lease model, the homeowner pays a fixed monthly fee to use the equipment, which is owned, maintained, and insured by the provider 8. A PPA differs slightly: the homeowner only pays for the electricity the system produces at a set rate, which is typically lower than the local utility's price 5. These options are attractive for households that do not have enough tax liability to benefit from credits or those who prefer zero-down financing 6.
New models have emerged in 2026 to address consumer concerns regarding the rigidity of long-term contracts. For instance, some providers now offer solar subscriptions that allow customers to cancel and have panels removed at no cost after a short period, such as three years 27. This flexibility contrasts with traditional 20 to 25-year agreements that often include annual price escalators. While TPO models generally offer lower lifetime savings than ownership, they remove the barriers of maintenance responsibility and the high initial capital requirements of a $30,000 system 1.
Operational Realities: Permitting, Batteries, and Net Metering
The financial viability of any solar project in 2026 is deeply influenced by local grid policies and technical requirements. Net metering, the credit a utility provides for excess power sent back to the grid, remains a major driver of savings, but its value varies sharply by jurisdiction 9. In California, for example, the NEM 3.0 rules and similar export-credit policies in Arizona have made battery storage central to the ROI calculation 2. Financing a system with an integrated battery increases the total cost but allows homeowners to maximize self-consumption of solar energy and provides backup power during grid outages 16.
Beyond the financial agreement, homeowners must navigate the permitting process, which is essential for maintaining warranties and insurance coverage. This involves obtaining building permits to confirm structural integrity, electrical permits to ensure code compliance, and often zoning or HOA approvals 29. Managing this paperwork efficiently is critical, as delays can impact the system's service date and eligibility for specific utility rebates 14. Homeowners are advised to use comprehensive cost models that include maintenance, potential inverter replacements, and local permit fees to avoid underestimating the total cost of ownership 30.
Conclusion and Risk Assessment
While the expiration of the federal residential tax credit has shifted the market, solar remains a viable energy solution in many U.S. regions due to rising grid electricity prices and improving technology efficiency 9. However, the financing decision now carries higher stakes. Homeowners must choose between maximizing long-term wealth through cash or home equity loans and prioritizing immediate cash flow through TPO models like leases or subscriptions 22. It is also important to recognize the risks associated with the solar industry, such as the potential for installer bankruptcy, which can complicate long-term service and warranty claims 27.
Ultimately, a successful solar transition in 2026 requires an objective evaluation of personal tax liability, expected duration of home ownership, and local utility policies 22. By comparing the true cost of financing inclusive of all fees and interest, and weighing that against the historical reliability and energy price trends in their specific area, consumers can determine which financing structure aligns with their financial objectives. Ongoing energy market volatility and advancements in battery storage continue to drive the evolution of these products across the United States 24.
Sources
- NerdWallet
- OhmSnap Blog
- OhmSnap Guide
- Solar Bid Analyzer
- US EPA
- Green Energy Calculators
- NPR
- SunPower
- AmeriSave
- Eagle Mountain Solar
- IOPscience
- Clean Energy CU
- SolarTech
- PermitDeck (Incentives)
- Electrek (30% dead)
- PowerOutage.us
- SunWise USA
- PermitDeck (Worth it)
- Finray
- WWNO
- SolarPanel.app (Navigating)
- SolarPanel.app (Loan vs Lease)
- Center for Responsible Lending
- SolarPanel.app (Understanding)
- Electrek (Safe harbor)
- USA-Net-Zero
- Finance-Commerce
- SolarCellz USA
- SolarPanel.app (Paperwork)
- SolarPanel.app (Mistakes)
Authored by MyTrendSpot team