Average physician assistant salaries across US regions: A Comprehensive Analysis of Regional Compensation Trends
The landscape for physician assistant (PA) compensation in 2026 is characterized by significant regional variation, driven by localized labor demand, cost-of-living adjustments, and differing legislative environments regarding scope of practice 1. As healthcare organizations continue to integrate advanced practice providers to bridge the gap in clinical staffing, regional wage data serves as a critical indicator of market competitiveness 2. National median compensation for full-time PAs was recently reported at $140,000, reflecting a 4.5% year-over-year increase 2.
Regional Wage Disparities and Compensation Benchmarks
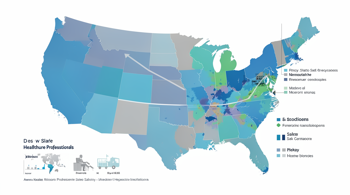
Geographic location is a primary driver of compensation, with coastal and western states frequently recording the highest nominal annual wages. For instance, states such as Washington, California, and Alaska consistently report annual mean wages exceeding $144,000 1. However, nominal salary figures do not account for regional economic pressures such as housing costs and tax burdens, which often dictate the actual purchasing power of those earnings 2.
Metropolitan areas further highlight this variance. In high-demand hubs like San Jose, California, median salaries for PAs can reach as high as $180,337, though these figures must be weighed against localized cost-of-living indices that impact discretionary income 5. Conversely, mid-size cities and regional hubs offer different value propositions, often characterized by lower costs of living that allow for greater wealth accumulation despite lower nominal base salaries 7.
The Impact of Cost-of-Living Adjustments
When adjusting for the cost of living, the list of top-earning locations shifts significantly. While California and New York offer high headline salaries, the adjusted real wage often places other states, such as Oklahoma or Indiana, at the forefront of financial feasibility 2. This phenomenon, often referred to as real wage arbitrage, demonstrates that a lower nominal salary in a rural or Midwest region may actually provide a superior quality of life compared to a high-paying role in a saturated coastal market 8.
| Region/State | Mean Annual Wage | Employment per 1k Jobs |
|---|---|---|
| Washington | $145,390 | 0.89 |
| California | $144,520 | 0.88 |
| Alaska | $144,460 | 1.41 |
| Texas | $132,980 | 0.69 |
| New Jersey | $131,070 | 1.13 |
Legislative Influence on PA Compensation
Scope-of-practice legislation, specifically regarding "Optimal Team Practice" (OTP) and autonomous practice, is actively reshaping the market 9. States that have updated their nomenclature to "physician associate" and expanded administrative authority, such as Oregon, New Hampshire, and Maine, are positioning themselves to attract talent by offering broader clinical latitude 10. Legislative changes that reduce the burden of on-site supervision allow for more efficient, flexible staffing models, which in turn can influence the compensation structures offered by employers 14.
Specialty-Driven Salary Variations
Beyond geography, specialty selection remains the most significant predictor of total compensation. PAs working in surgical subspecialties, such as cardiothoracic surgery or orthopedics, consistently earn at the higher end of the spectrum, often reaching $150,000 to $160,000 or more 6. Emergency medicine has also seen a recent surge, with pay jumps of nearly 9.5% between 2025 and 2026, driven by high demand for acute care capacity 4.
These specialty-specific trends often transcend state lines. While a primary care PA in a rural state may earn less than a surgical PA in that same state, the difference is often less pronounced than the variance seen between specialties within the same metropolitan hub. Understanding the intersection of clinical specialty and geographic market is essential for PAs evaluating long-term career growth and income potential 8.
Workforce Trends and Retirement Outlook
The PA workforce is also experiencing a shift in demographic stability. Nationally, approximately 5.8% of the PA workforce reports plans to retire within the next five years, with significantly higher rates in states like Wyoming (14.3%) and Alaska (14.2%) 3. As these providers exit the workforce, the demand for replacement talent in these specific regions is expected to drive up localized salary offerings in an attempt to attract clinicians to underserved or remote areas 9.
Employers in these regions are increasingly utilizing sign-on bonuses, relocation incentives, and performance-based reward systems to remain competitive against larger, urban-based hospital systems. This environment creates a dynamic, albeit fragmented, job market where candidates with the willingness to relocate to high-need areas can often command premium compensation packages 15.
Methodology and Data Transparency
The data presented in this report is derived from aggregate compensation surveys, including self-reported salary data from the American Academy of Physician Associates (AAPA) and wage information from the Bureau of Labor Statistics (BLS) Occupational Employment and Wage Statistics program 2. It is important to note that these figures typically exclude potential bonuses, which were received by over 58% of PAs in recent surveys, with a median payout of approximately $6,000 2.
When reviewing compensation data, clinicians should distinguish between base salary, production-based pay, and total cash compensation. Many modern employment agreements utilize hybrid models where base salary is augmented by Relative Value Unit (RVU) production, tying income directly to clinical productivity metrics. Consequently, the "average" salary often serves as a baseline, whereas individual earnings are frequently dependent on specific practice settings, call requirements, and administrative responsibilities 12.
Sources
- Physician Assistant Salary by State 2026, World Population Review
- Physician Assistant Salary 2026: How Much Do PAs Make?, The PA Life
- 2024 Statistical Profile of Board Certified PAs by State, NCCPA
- 8 physician assistant pay stats to know in 2026, Becker’s ASC
- Physician Assistant Salary by City, SalaryMetro
- Physician Assistant Salary (2026), ResumeGeni
- Physician Assistant Salary Data Across 81 Cities (2026), Orbyt
- Physician Assistant Salary (2025): Average Pay by State, Specialty & Experience, MedSalaryData
- 10 Best Cities for Physician Assistants in 2026, The Physician Assistant Life
- Three States Change Physician Assistant Title to Physician Associate, JMCO
- 2024 Statistical Profile of Board Certified PAs, NCCPA
- 2026 Advanced Practice Provider Compensation Survey, Total Compensation Solutions
- Characteristics of family medicine physician associates/assistants in the US, BMC Health Services Research
- PA Scope of Practice by State: What Employers Need to Know in 2026, MedicalRecruiting.com
- $500K+ Physician Assistant Jobs With Visa Sponsorship in 2026, RECRUITMENT SEAT
Authored by MyTrendSpot team