Compare Home Repair Costs by Region: A Data-Driven Analysis for U.S. Homeowners in 2026
Home repair costs across the United States do not follow a single national average. The same roof replacement that costs $10,000 in Texas runs $15,500 in California and just $7,200 in Mississippi, according to 2026 state-level benchmarking data. 1 A bathroom remodel priced at $15,000 in Nashville can reach $19,500 to $21,000 in Boston and drop to $12,000 to $13,500 in a small Midwestern town. 2 These are not minor rounding differences; they represent fundamental budget realities that change whether a project is financially viable in a given year.
The Scale of Regional Price Variation
The cost gap between the least and most expensive U.S. states for home improvement projects is approximately 61 percent, spanning from Mississippi at 0.84 times the national average to Hawaii at 1.35 times. 3 Expressed differently, Hawaii averages 58 percent above national prices while Mississippi averages 28 percent below. 1 The 2026 spread across all 50 states has reached 84 percentage points, the widest recorded since 2008. 4 For a single illustrative project, a $40,000 kitchen remodel costs $62,000 in Hawaii, $56,000 in California or New York, and roughly $28,800 in Mississippi when state multipliers are applied. 4
Regional cost indexes, benchmarked so that a national average equals 100, show Northeast states including New York, New Jersey, Connecticut, and Massachusetts scoring 120 to 140, Pacific states scoring 115 to 135, Mountain West states ranging 95 to 110, and Southeast states ranging 85 to 100. 5 In major metro comparisons using real public building permit records, electrician work in Chicago, Illinois carries a median declared permit value of $5,000 compared to $2,000 in Dallas, Texas, a 150 percent difference on the same trade. 6
Primary Cost Drivers Across All Regions
Labor is consistently identified as the dominant variable in regional pricing. In high-cost-of-living markets such as San Francisco, New York, Boston, and Seattle, skilled tradespeople earn $30 to $60 per hour. In lower-cost markets including Memphis, Birmingham, Indianapolis, and Kansas City, comparable skills command $18 to $35 per hour. 7 Since labor accounts for 40 to 65 percent of most repair bills, this single factor can effectively double the total project cost across regions. 8
Union density in construction is identified as the single most statistically explanatory variable for state-level cost variation. States above 14 percent overall union density, including Hawaii at 26.5 percent, New York at 20.6 percent, New Jersey at 16.2 percent, and Massachusetts at 14.6 percent, show construction wages 25 to 55 percent above states below 5 percent union density, such as Mississippi, Arkansas, and South Carolina. 3 Beyond labor, contractor insurance and bonding costs rose 15 to 25 percent between 2023 and 2026, with those increases passed directly through to consumers. 5
2026 National Benchmarks for Major Repair Categories
Permit-based data from over 3.4 million indexed building permits provides the most transparent available view of what contractors actually charge. National median permit values by trade include: general contractor work at $21,500 median with a typical range of $5,200 to $127,365; HVAC technicians at $5,650 median and $2,800 to $10,590 range; plumbers at $3,000 median with a $1,343 to $7,000 range; and roofers at $9,500 median with a $5,000 to $17,400 range. 9 Heat pump installers show a median of $6,500, deck builders $8,000, and solar installers $11,000 at the national level. 9
| Project Category | National Average | Low-Cost State (MS) | High-Cost State (HI) |
|---|---|---|---|
| Roof Replacement | $9,800 | $7,056 | $15,484 |
| HVAC Replacement | $7,500 | $5,400 | $11,850 |
| Kitchen Remodel (mid) | $27,000 | $19,440 | $42,660 |
| Bathroom Remodel (mid) | $12,400 | $8,928 | $19,592 |
| Window Replacement (15 units) | $9,000 | $6,480 | $14,220 |
| Deck (300 sqft) | $7,200 | $5,184 | $11,376 |
Most and Least Expensive States: Full Context
The highest-cost tier consistently includes Hawaii, California, New York, Alaska, Massachusetts, Connecticut, and New Jersey. Hawaii sits at a 1.55 cost index (55 percent above national average), California and New York both at 1.40, Alaska at 1.35, and Massachusetts at 1.32. 4 A separate Pasha Funding analysis confirmed Hawaii as the most expensive state for contractor operations, attributing this to its second-highest state price level in the U.S. per Bureau of Economic Analysis data and unusually high energy costs. 10
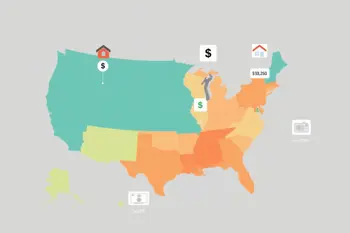
The most affordable states include Mississippi, Arkansas, South Carolina, Alabama, and Oklahoma, which consistently run 10 to 28 percent below the national average. 11 A plumber in Allentown, Pennsylvania charges 15 to 20 percent more than one performing identical work in Memphis, Tennessee. A garage door spring replacement in Colorado Springs costs $80 more than the same job in Mobile, Alabama. 12 Plumbing costs specifically vary 67 percent between the cheapest and most expensive cities nationally, with San Francisco hourly rates ranging $120 to $200 compared to $60 to $100 in Nashville. 13
Material Cost Trends and Regional Variations in 2026
While labor creates the widest regional gaps, material costs contribute their own layer of complexity. Construction input prices rose 9.2 percent cumulatively from December 2023 to April 2026, per BLS Producer Price Index data. Aluminum mill shapes led with a cumulative increase of 44.8 percent; softwood lumber rose 13.2 percent year over year through April 2026; asphalt shingles were nearly flat at 0.2 percent. 3 Liquid asphalt binder prices spiked sharply in early 2026, with Maryland Asphalt Association reporting May 2026 prevailing prices of $800 per ton, up from $615 in January 2025. 3
Geographic factors further amplify material costs. Alaska and Hawaii pay the most for materials due to shipping distance and logistics overhead. Lumber costs more in areas far from timber regions. Stucco repair is relatively inexpensive in the Southwest where stucco construction is standard, but costs more in the Northeast where contractor familiarity and material availability are lower. 7 Roofing remains the largest single home improvement category by claim volume nationally, with Verisk reporting $31 billion in U.S. roof repair and replacement spending in 2024, up nearly 30 percent since 2022. 3
Risks, Limitations, and Planning Considerations
National cost averages present a statistically misleading baseline for individual homeowners. The median home renovation project costs $2,800 nationally, but the average is $6,342 when major structural and addition projects are factored in. 14 Regional cost multipliers swing from negative 17 percent below the national average in El Paso to positive 30 percent above in San Jose. 14 Homeowners who skip the permitting process face compounding financial risk: unpermitted work creates an average 15 to 25 percent price reduction at resale or requires retroactive permitting, and voids most insurance coverage on damage claims. 15
Seasonal demand adds an additional layer of unpredictability. Peak seasons can add 10 to 20 percent to labor costs independent of regional baseline rates. 16 Emergency or after-hours service calls add 50 to 100 percent to standard rates in all markets. 12 The average American household currently spends $2,041 on routine home maintenance and $1,143 on emergency repairs annually, for a combined outlay approaching $3,200 per year, with that figure rising significantly in high-cost regions. 8 Obtaining three or more itemized quotes remains the most reliable method for assessing whether a local estimate aligns with regional benchmarks, given that the cheapest bid results in the most expensive outcome approximately 30 percent of the time after change orders and rework. 15
Sources
- CostPrism - Home Improvement Cost by State 2026: costprism.com/guides/home-improvement-cost-by-state/
- ProjectCostCalc - Home Improvement Costs by Location (2026): projectcostcalc.com/costs-by-location/
- Costorie - 2026 Contractor Pricing Survey: costorie.com/research/2026-contractor-pricing-survey
- HavenCostGuide - 2026 Home Renovation Cost Index by State: havencostguide.com/guides/2026-home-renovation-cost-index-by-state
- CostSignals - 2026 Home Repair Cost Index: costsignals.com/guides/home-repair-cost-index-2026
- ProFix Directory - Compare Contractor Costs Between Two Metros: profixdirectory.com/tools/compare-costs
- DealRun - Repair Costs Vary by Region: dealrun.ai/blog/repair-costs-by-region
- HandymanFix - Home Repair Cost Guide 2026: handymanfix.com/complete-home-repair-cost-guide-2026/
- ProFix Directory - Real Cost Index 2026: profixdirectory.com/research/real-cost-index-2026
- Illinois News Desk / Pasha Funding - Americas Most Expensive States for Home Improvement Contractors: news.illinoisnewsdesk.com/story/622905/
- Costorie - Home Improvement Cost by State 2026: costorie.com/blog/home-improvement-cost-by-state
- ProMatch Now - Home Repair Costs By City 2026: promatchnow.com/home-repair-costs-by-city-2026/
- Recommended.app - Home Service Costs Across 50 US Cities 2026: recommended.app/blog/research/home-service-costs-across-50-cities-2026
- CostToRenovate - Home Renovation Cost Report 2026: costtorenovate.com/reports/home-renovation-cost-2026/
- Homestery - The 2026 Home Improvement Cost Report: homestery.com/reports/2026-home-improvement-cost-report
- FixHomeCosts - Home Remodeling Cost Guide 2026: fixhomecosts.com/guides/remodeling-cost-guide/
Authored by MyTrendSpot team