Pharmacist pay by mid-career and states: A data-based comparison of experience and location
Pharmacist pay by mid-career and states is shaped by two central variables: professional experience and labor-market location. Available 2026 salary guides place mid-career earnings broadly between $125,000 and $165,000, while federal wage data provides a more consistent basis for comparing national and state compensation. The figures below distinguish reported averages, medians, percentiles, and projections so that salary comparisons are not treated as guaranteed employment offers.
National pharmacist pay benchmarks
The U.S. Bureau of Labor Statistics reported a median annual pharmacist wage of $137,480 in May 2024. BLS occupational data also reports wage percentiles and employment estimates, allowing readers to distinguish the middle of the occupation from entry-level and upper-end compensation. A separate 2025 BLS-based compilation lists a national median of $140,910, while its 2026 estimate is $143,489, calculated from historical growth rather than presented as a finalized federal observation. 1 2
Other salary sources produce different national figures because they use different samples and definitions. One 2026 estimate reports a $137,000 median, an $87,000 entry-level figure, and $172,000 for the 90th percentile. Another guide lists $132,750 as the median, with the middle 50% between $106,075 and $150,560. These differences do not necessarily indicate a contradiction; they reflect distinctions between employee-reported pay, advertised salaries, modeled estimates, and BLS occupational surveys. 8 9 10
What mid-career pharmacists may earn
Mid-career generally refers to pharmacists with roughly five to ten years of experience, although salary publishers do not apply one universal definition. The Salary Insights guide places this group at $135,000 to $165,000, while another compensation guide reports $125,000 to $140,000. A metro-based estimate identifies the median, labeled mid-career, at $136,177 per year, or $65.47 per hour. These ranges should be read as market benchmarks rather than fixed pay scales. 5 6
| Career stage or measure | Reported annual amount | Source context |
|---|---|---|
| Early career, 0 to 5 years | $105,000 to $130,000 | Salary guide estimate |
| Mid-career, 5 to 10 years | $135,000 to $165,000 | Salary guide estimate |
| Mid-career median | $136,177 | Metro-area estimate |
| Experienced, 10 or more years | $160,000 to $210,000 or more | Salary guide estimate |
Experience alone does not determine the size of a pay increase. Residency training, board certification, specialty practice, management responsibility, health-system employment, and employer type can change compensation. Specialty pharmacist ranges in one state-focused guide are listed at $145,000 to $175,000, while pharmacy director roles are listed at $160,000 to $220,000. Actual compensation may also include bonuses, shift differentials, sign-on payments, ownership income, and benefits, none of which are captured consistently in salary tables. 7
States with higher reported pharmacist pay
State comparisons show a substantial geographic spread. A 2026 state table lists California at $165,000, Alaska and Oregon at $163,000, Washington at $157,000, and Minnesota at $155,000. Another BLS-based guide reports annual mean wages of $157,280 in California, $151,600 in Alaska, $149,550 in Oregon, $148,550 in Washington, and $143,210 in Minnesota. Differences between these figures reflect whether the table uses median, mean, projected, or modeled values. 3 11
| State | Reported annual figure | Context |
|---|---|---|
| California | $157,280 to $165,000 | Mean or median estimates |
| Alaska | $151,600 to $163,000 | Mean or median estimates |
| Oregon | $149,550 to $169,291 | Mean or modeled median estimates |
| Washington | $148,550 to $157,000 | Mean or median estimates |
| Minnesota | $143,210 to $155,000 | Mean or median estimates |
Higher nominal pay does not automatically mean greater purchasing power. California, Alaska, Oregon, and Washington are repeatedly identified among higher-paying locations, but metropolitan housing and daily expenses can materially affect the value of a salary. State-level comparisons also conceal differences between urban and rural labor markets, hospital systems, retail employers, and specialty practices. The appropriate comparison therefore includes both compensation and the expenses associated with the intended location. 3 5
States with lower or mixed compensation patterns
Several salary guides identify Mississippi, Arkansas, South Dakota, Wyoming, and Montana as lower-paying states, although individual tables do not always rank these states identically. A separate 2026 table places South Dakota at $140,000, while Montana and Wyoming appear at $137,000, illustrating why rankings can change depending on the dataset and calculation method. State averages may also be affected by the concentration of large medical centers, rural vacancies, retail employment, and specialty positions. 3 5
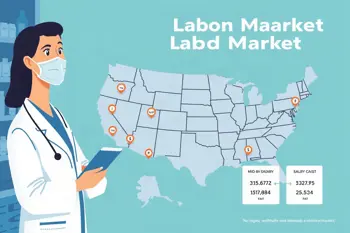
Texas demonstrates the importance of separating statewide averages from local markets. A Texas estimate lists an average median of $143,451 for 2026, with projected city figures ranging from $127,196 in El Paso to approximately $164,211 in Midland. Another source reports $127,300 as the Texas average. The difference illustrates market friction within one state: employer demand, metropolitan composition, data year, and projection methodology can produce materially different results for the same occupation. 4 7
Practice setting and career progression
Practice setting is a major contributor to pharmacist compensation. Reported 2026 ranges place retail pharmacist pay at approximately $125,000 to $135,000, hospital or clinical pharmacist pay at $130,000 to $150,000, specialty pharmacist pay at $145,000 to $175,000, and pharmacy director pay at $160,000 to $220,000. These are category ranges, not universal guarantees. Employer size, schedule, clinical duties, geographic market, credentials, and supervisory scope can move an individual offer above or below them. 7
O*NET classifies pharmacists under occupation code 29-1051.00 and describes the occupation through its tasks, knowledge requirements, skills, and related career information. Those responsibilities can expand in clinical, oncology, infectious disease, critical care, nuclear pharmacy, medication therapy management, vaccination, and chronic disease counseling roles. Specialty credentials and residency training may support advancement, but they also involve eligibility requirements, additional training, licensing compliance, and continuing professional maintenance. 4 12
Taxes, cost of living, and purchasing power
Salary comparisons should distinguish gross compensation from take-home pay. A 2026 tax illustration for a single filer earning $130,000, using a $15,000 standard deduction and no pretax deductions, estimates $20,447 in federal income tax and $9,945 in FICA, leaving approximately $99,608 before state taxes and other deductions. The same guide lists Texas, Florida, Washington, and Nevada as examples of states without a broad state individual income tax, but insurance, retirement contributions, local taxes, and filing circumstances still affect actual net pay. 7
Cost-of-living adjustments can reverse the apparent order of locations. A metro comparison lists San Francisco at $187,661 in nominal median salary but $110,845 after its stated cost-of-living adjustment. New York is listed at $162,376 nominally and $126,166 adjusted, while Portland is listed at $143,871 nominally and $121,104 adjusted. Such adjustments are estimates, not personal budgets, yet they demonstrate why mid-career relocation decisions require more than a statewide wage ranking. 6
How to interpret salary data responsibly
BLS state wage tables are the most consistent foundation for state-to-state comparisons because they provide standardized occupational measures, including employment counts and wage percentiles. Salary websites can add current market context, experience estimates, and employer-reported information, but their methodologies vary by sample size, job-title definitions, update schedule, and whether figures are observed or projected. A careful comparison should record the source, year, wage measure, practice setting, and geographic level before drawing conclusions. 2 3
The employment outlook adds another qualification. The BLS projects pharmacist employment to decline slightly from 2023 through 2033, while still forecasting thousands of openings annually because of retirements and workers leaving the occupation. State projections from Projections Central and local labor-market resources can provide additional context, but projected openings do not guarantee hiring in a particular city or specialty. Licensing rules, scope-of-practice regulations, employer restructuring, and competition among pharmacy graduates remain relevant considerations. 1 12
Sources
- U.S. Bureau of Labor Statistics, Occupational Outlook Handbook: Pharmacists
- U.S. Bureau of Labor Statistics, Occupational Employment and Wage Statistics: Pharmacists
- U.S. Bureau of Labor Statistics, State Occupational Employment and Wage Resources
- O*NET OnLine, Pharmacists, occupation code 29-1051.00
- SalaryMetro, Pharmacist Salary by Metropolitan Area and Experience
- Salary Insights, Pharmacist Salary USA 2026
- MyCashCalc, Pharmacist Salary After Taxes by State 2026
- Salary by State, Pharmacist Salary 2026
- ZipRecruiter, Pharmacist Salary Distribution
- Glassdoor, U.S. Pharmacist Salary Estimates
- CareerOneStop, Pharmacist Career and Wage Resources
- Projections Central, State Occupational Projections
Authored by MyTrendSpot team