Electrician compensation by state across the United States: A data-based comparison
Electrician compensation by state across the United States varies substantially, and the published figures depend on whether the comparison uses median pay, average pay, hourly wages, or industry-wide earnings. The Bureau of Labor Statistics classifies electricians under Standard Occupational Classification 47-2111 and reports employment, hourly wages, annual wages, and percentile estimates by state and area. 1
How electrician compensation is measured
The BLS Occupational Employment and Wage Statistics program is the primary reference for consistent state comparisons. Its occupational data separates electricians from broader contractor categories and can be reviewed alongside CareerOneStop salary information, which also provides state and local wage estimates. A consistent BLS release and one consistent measure, such as median annual wage or annual mean wage, generally produces a more meaningful comparison than combining unrelated salary websites. 1
Median and mean wages describe different parts of the labor market. A median identifies the midpoint, while a mean can be lifted by highly paid industrial, utility, senior, or supervisory electricians. Published estimates also differ because Indeed, ZipRecruiter, Payscale, Salary.com, and similar services use job postings, self-reported information, or title-specific benchmarks rather than one identical government survey method. 1
States with the highest reported wages
One BLS-based 2026 state table reports the highest median annual wages in Oregon at $97,320, Washington at $96,530, and Illinois at $96,360. Hawaii follows at $83,200, while Massachusetts is reported at $82,120. The same table lists employment of 9,830 electricians in Oregon, 18,380 in Washington, 22,880 in Illinois, 3,020 in Hawaii, and 16,570 in Massachusetts. 3
A separate 2023 compilation reports a similar upper tier, although its figures are lower or differently defined: Illinois has a median annual wage of $95,090, Hawaii $92,750, Washington $82,020, Oregon $88,770, and Massachusetts $81,170. These differences illustrate why publication year, wage definition, and survey methodology must be checked before ranking states. A national median shown in the same compilation is $62,350. 4
Lower reported wages and geographic spread
The available state tables show a wide national spread. In the 2023 data, Florida’s median annual wage is $54,480, South Carolina’s is $55,490, and Mississippi’s is $51,470. By contrast, the highest median in that dataset is Hawaii at $92,750. The difference between these reported medians is more than $40,000 annually, although the figures should not be treated as a direct measure of take-home pay or purchasing power. 4
Another business-focused dataset reports average annual pay of $61,052 in Florida, $59,499 in South Carolina, and $94,372 in the District of Columbia. That source also reports $72,970 in Texas, $88,867 in California, $92,462 in Illinois, and $91,566 in Massachusetts. These values describe average pay connected to electrical businesses and therefore are not interchangeable with BLS occupational medians. 7
Cost of living changes the interpretation
Nominal wages do not show how far compensation goes after housing and other local costs. The Electrician Payoff Report uses a real-payoff measure that adjusts published wages against a one-bedroom housing benchmark. It reports Illinois at $47.89 per hour, Oregon at $47.13, Washington at $42.78, Hawaii at $42.18, and Alaska at $42.01. The report’s median real payoff across states and the District of Columbia is $33.55 per hour. 5
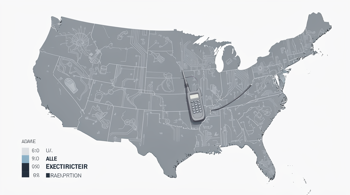
Housing pressure differs markedly even among high-wage locations. The same analysis reports one-bedroom housing pressure of 3.1 gross-pay shifts in Wyoming, 3.9 in Illinois, 4.0 in Oregon, 5.1 in Washington, 5.7 in Hawaii, 7.2 in Massachusetts, and 8.1 in New York. This means a state with a high nominal wage may not deliver the strongest practical purchasing power after housing costs are considered. 5
Licensing, experience, and job specialization
Licensing is a central regulatory factor. A licensing guide reports that 43 states issue statewide electrician licenses, while other jurisdictions rely on contractor, county, or city systems. The typical progression is apprentice, journeyman, and master electrician, with many systems requiring about four years or 8,000 hours of supervised experience for journeyman status and another one to two years for master-level eligibility. Requirements and examination rules vary by issuing authority. 6
Compensation also reflects the work performed and the worker’s qualifications. Commercial, industrial, and utility assignments may pay more than residential work when they involve greater technical complexity, hazardous conditions, shift schedules, travel, or overtime. Apprenticeship completion, journeyman or master licensing, specialized certifications, supervisory duties, and accumulated experience can all affect pay, but published state medians combine workers across these categories. 1
Employment demand and market considerations
State compensation is connected to local construction activity, labor demand, union representation, licensing rules, and the mix of residential, commercial, industrial, and utility work. A 2025 national BLS summary reported a mean annual wage of $71,490, a median hourly wage of $30.38, and approximately 757,220 electricians nationally. That source also reported projected occupational growth of 9.5% through 2034, while noting that the state table used May 2024 data. 8
Business concentration provides additional context but does not establish individual earnings. One dataset counts 29,385 electrical businesses in Texas, 25,439 in California, and 24,038 in Florida, with employment totals of 99,988, 120,017, and 70,151 respectively. It reports approximately 243,035 electrical businesses nationwide, including solo operators, and notes that business ownership, overhead, self-employment taxes, insurance, tools, vehicles, and nonbillable periods can make business revenue very different from employee compensation. 7
How to compare state figures responsibly
A reliable comparison begins by identifying the source year, occupational definition, wage statistic, and population covered. A BLS median for all electricians should not be directly ranked beside an advertised wage, a self-reported salary, a contractor’s industry average, or an hourly billing rate. Consumer-facing service rates can also include business overhead and are not the same as wages paid to an employee. 1
Readers should also verify licensing requirements with the relevant state, county, or city authority because eligibility, supervised hours, exams, renewals, and permitted work can change. The practical risks include comparing outdated releases, overlooking housing costs, assuming a license transfers automatically between jurisdictions, or treating overtime-heavy specialties as typical wages. State-level compensation is therefore best understood as a market benchmark rather than a guaranteed individual outcome. 6
Sources
- U.S. Bureau of Labor Statistics, Electricians, SOC 47-2111: https://www.bls.gov/oes/current/oes472111.htm
- Electrician Salary, Electrician Salary by State: https://electricianwages.com/salary/
- Get License Map, How Much Do Electricians Make?: https://getlicensemap.com/blog/how-much-do-electricians-make
- World Population Review, Electrician Salary by State: https://worldpopulationreview.com/state-rankings/electrician-salary-by-state
- Best Electrician Jobs, Electrician Payoff Report: https://www.bestelectricianjobs.com/research/electrician-payoff-report/2026
- Trade Schools Directory, Electrician License Requirements by State: https://tradecolleges.org/blog/trade-programs/electrician-license-requirements-by-state
- Smarfle CRM, Electrician Business Statistics by State: https://www.smarfle.com/small-business-statistics/electrician-business-statistics
- Skilled Trades IQ, Electrician Salary by State: https://skilledtradesiq.com/salaries/electrician/
Authored by MyTrendSpot team