How much do physical therapists make in each U.S. region? An Analytical Report on Geographic Wage Variances
Understanding the current compensation landscape for physical therapists (PTs) requires looking beyond national averages to examine regional nuances and economic variables. As of 2026, the national median annual wage for physical therapists is reported at approximately $101,020 4. While this figure provides a baseline, actual earnings fluctuate significantly based on geographic location, local cost-of-living indices, and specific practice settings 1, 15. This report details these variations by analyzing BLS Occupational Employment and Wage Statistics (OEWS) data alongside regional economic factors.
The Impact of Geography on Nominal Salaries
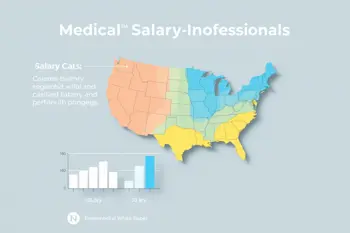
Geographic location remains one of the primary drivers of base salary variation for physical therapists. Western states, including California, have consistently reported some of the highest raw annual mean wages, frequently exceeding $114,000 in major metropolitan areas 1, 7. Conversely, states in the Great Plains region have historically occupied lower rankings in national mean wage comparisons, often showing annual averages below the national baseline 6. These disparities are largely attributed to the concentration of specialized healthcare facilities in high-density coastal urban centers compared to more rural settings 15.
For instance, median annual pay in cities like San Francisco can reach upwards of $141,980, whereas smaller markets like Rochester, New York, or rural sectors in Kentucky and Missouri may report median figures significantly lower 5, 7. This geographic spread is not merely a reflection of regional demand, but also of local wage-setting practices influenced by state-specific healthcare infrastructure, labor laws, and the competitive density of outpatient clinics 2, 15.
Purchasing Power and Cost-of-Living Adjustments
When evaluating compensation, it is essential to distinguish between nominal salary and real purchasing power. While California and Hawaii often lead in raw wage figures, their high cost-of-living indices significantly alter the practical value of those earnings 1. When applying Bureau of Economic Analysis Regional Price Parities (RPP), states with lower costs of living, such as Texas and Nevada, often demonstrate higher real purchasing power than coastal counterparts 1, 2. This adjusted perspective is critical for professionals weighing relocation or comparing disparate job offers across different state lines 18.
St. Louis, Missouri, serves as a notable example where a median salary of $100,600, when adjusted for a cost-of-living index of 90, yields a purchasing power equivalent to approximately $111,778 in a national-average market 17. This contrast illustrates that a lower headline salary in a low-cost region may offer a standard of living superior to a higher nominal salary in an expensive metro area 17. Analysts frequently utilize these parity models to provide a more honest assessment of professional income strategy 18.
Salary Variations by Clinical Setting
Beyond regional borders, the specific clinical environment plays a decisive role in total compensation. Home health and travel physical therapy positions typically reside at the higher end of the earnings spectrum, with reported averages often ranging from $100,000 to $140,000 3. In contrast, hospital-based outpatient roles or positions in school districts tend to fall in the lower or mid-range of these estimates, partly due to different reimbursement models and operational structures 3, 16. These settings prioritize different employment structures, such as contract-based travel work versus the stable, benefit-heavy profiles of hospital employees 16.
| Setting | Estimated Average Annual Salary |
|---|---|
| Home Health | $105,000 - $130,000 |
| Travel PT | $100,000 - $140,000 |
| Skilled Nursing (SNF) | $95,000 - $115,000 |
| Hospital Inpatient | $90,000 - $110,000 |
| Schools | $75,000 - $90,000 |
The Influence of Experience and Specialization
Professional experience and clinical certifications serve as significant multipliers for base compensation. Data indicates that physical therapists with over 10 years of experience and specialized board certifications can command salaries 30 to 40 percent higher than entry-level clinicians 1. The current median range for a physical therapist in 2026 spans approximately $83,000 at the 25th percentile to $117,000 at the 75th percentile, underscoring the substantial impact of tenure and advanced expertise on earnings 2. Clinicians who attain niche credentials often move toward the 75th or 90th percentiles of their regional pay bands 1, 8.
Market Trends and Economic Factors
The physical therapy labor market is characterized by strong demand and consistent growth. Projections from the Bureau of Labor Statistics indicate an 11 percent increase in employment for the 2024–2034 decade, driven primarily by an aging population and the increasing prevalence of musculoskeletal conditions 4, 9. While salary growth is steady, it is influenced by the rising educational costs associated with the Doctor of Physical Therapy (DPT) degree, which has been the required entry credential since 2016 4, 5. This creates a unique financial dynamic where graduates often enter the workforce with significant debt loads, making the choice of practice location and setting a high-stakes decision for early-career professionals 5.
Regulatory Oversight and Structural Challenges
It is important for clinicians to acknowledge that salary data is inherently tied to complex reimbursement systems and regulatory environments. Differences in state licensing requirements and variations in state-level healthcare policy affect both the availability of positions and the ceiling for wage growth 13. Practice owners and clinicians must navigate these systemic factors, which include prior authorization workflows, CMS reimbursement mandates, and regional density of care providers 14, 15. Awareness of these variables is vital for those looking to maximize their earning potential while balancing the realities of long-term career sustainability 18.
Sources
- Physitrack: Physical Therapist Salary by State 2026 Guide
- Orbyt: Physical Therapist Salary Data Across 81 Cities 2026
- Wealthvieu: How Much Do Physical Therapists Make in 2026
- Bureau of Labor Statistics: Occupational Outlook Handbook 2024-2034
- PayByState: Physical Therapist Salary Statistics 2024-2026
- Health Guide USA: Physical Therapist Pay in the Great Plains
- SalaryTruth: 2026 Physical Therapist Pay Benchmarks
- Hyring: Physical Therapist Salary in USA Pay Guide
- Proactive Chart: 2026 PT Salary and Retention Strategies
- Career.com: How Much Does a PT Make 2025
- All Allied Health Schools: Salary Guide for Physical Therapists
- Job Applications: PT Salary Trends 2026
- Physical Therapist Pay: Hourly Rates and Projections 2026
- Berxi: The Best States for Physical Therapists
- Physical Therapist Pay: Minnesota Market Analysis
- SalaryTruth: San Francisco PT Compensation Report
- SalaryTruth: St. Louis PT Compensation Report
- EatHealthy365: DPT Degree Salary Expectations by State
- MarketPressRelease: Respiratory vs Physical Therapist Pay Gap Analysis
- Vivian: Travel Physical Therapist Job Data 2026
Authored by MyTrendSpot team