What medical laboratory technologists make in each state: a U.S. salary comparison and industry analysis
National Salary Trends and Growth Projections
The medical and clinical laboratory field serves as a critical pillar of the U.S. healthcare system, with the Bureau of Labor Statistics (BLS) reporting a national median annual salary of $62,930 based on 2025 actual data 1. Current estimates for 2026 suggest a median salary of approximately $64,843, reflecting a consistent growth trajectory 1. When analyzing these figures, it is essential to distinguish between the broader category of clinical laboratory technologists and technicians-which includes diverse skill levels and credentials-and the specific roles identified by occupational code 29-2011 4, 8.
Long-term data indicates that the national median salary has risen from $53,120 in 2019 to the current estimated levels, demonstrating a stable upward trend 1. Projections through 2027 suggest the median may reach $66,814 based on a historical compound annual growth rate (CAGR) of 3.04% 1. While these figures provide a baseline, they do not account for individual variances in experience, institutional setting, or regional cost-of-living differences that significantly impact actual take-home pay 1.
Geographic Disparities in Compensation
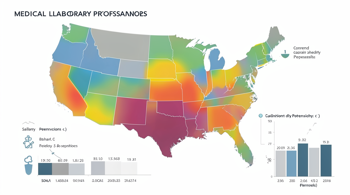
Salary figures for laboratory professionals vary significantly when crossing state lines. For instance, Massachusetts has reported a median annual salary of $79,120, a figure notably higher than the national average, attributed in part to the state's healthcare infrastructure and market conditions 6. Conversely, other regions may see median figures closer to the $60,000 to $65,000 range, highlighting the necessity of evaluating state-specific economic data rather than relying solely on national medians 3, 7.
Alaska provides a unique case study in regional compensation. With a 2026 projected median salary of $68,081, the state’s figures are influenced by local market dynamics, including the cost of living and specific geographic demand 8. However, when adjusted for the Bureau of Economic Analysis (BEA) regional price parity-which sits at 106.1 for Alaska-the actual purchasing power is approximately $64,167, placing it much closer to the U.S. baseline 8. This reinforces the importance of considering local purchasing power alongside nominal wage data.
The Role of Licensing and Certification in Wage Potential
Professional licensure and certification act as significant levers for salary growth within the laboratory sciences. Certain states, such as California, New York, and Florida, mandate specific state-level licenses for clinical laboratory personnel, which can influence both entry barriers and salary floors 1, 9. In California, for example, the regulatory environment requires both national certification and a state-specific license from the Department of Public Health, affecting the pipeline of available professionals and institutional compensation strategies 9.
Certification from bodies such as the American Society for Clinical Pathology (ASCP) is frequently a prerequisite for higher-level positions and specialty roles. Those who obtain advanced certifications-particularly in blood banking, microbiology, or molecular diagnostics-often command higher wages than their non-certified counterparts 3. This premium is particularly evident when comparing entry-level roles to senior positions, where the gap between the 10th percentile and the 90th percentile can exceed $50,000 annually in specific high-demand states 6, 7.
Impact of Work Environment and Shift Differentials
The type of facility where a technologist is employed significantly influences annual earnings. Hospital-based laboratories, which often operate 24/7, frequently provide shift differentials for night, weekend, and holiday work that can bolster total compensation by $5,000 to $10,000 per year 3. In contrast, reference laboratories or private physician offices may offer more standard weekday schedules but often at different pay grades, reflecting the varying operational requirements of these healthcare settings 3, 4.
Furthermore, travel technologist positions continue to be a distinct segment of the market, offering annual equivalent earnings ranging from $90,000 to $120,000 in certain scenarios 3. These roles provide a significant premium for mobility, though they often lack the long-term benefits or job security associated with permanent staff positions 3. Prospective professionals should weigh these short-term gains against the long-term career stability and professional development opportunities present in traditional hospital-based roles 3.
Understanding Labor Market Variables
While nominal salary figures are frequently cited, they do not tell the whole story. The Bureau of Labor Statistics (BLS) Occupational Employment and Wage Statistics (OEWS) survey serves as the gold standard for state-level comparisons 1, 4. However, it is vital to remember that these figures represent a snapshot of the labor market. Factors such as the mix of part-time versus full-time staff, the density of specialized facilities, and local unemployment rates all contribute to the volatility of these metrics over time 1, 5.
The following table illustrates the typical distribution of earnings for this occupational category based on percentiles, providing a clearer picture of the range beyond the median:
| Percentile | Estimated Annual Salary Range |
|---|---|
| 10th Percentile (Entry) | $38,000 - $47,000 |
| 50th Percentile (Median) | $60,000 - $65,000 |
| 90th Percentile (Top) | $85,000 - $105,000 |
As indicated by this data, the spread is considerable, suggesting that career advancement is heavily dependent on the professional's ability to navigate certification milestones and strategic geographic placement 3, 7.
Regulatory Oversight and Future Employment Outlook
The broader job outlook for clinical laboratory technologists and technicians is projected to grow by 2% from 2024 to 2034, which is slower than the average for all occupations 4. Despite this relatively limited growth, approximately 22,600 job openings are expected annually due to the need to replace workers who exit the labor force or transition to other roles 4. This stability is a defining characteristic of the field, though it implies that competition for high-paying roles remains strong 4.
Regulatory frameworks also play a role in shaping the profession. As technology advances and diagnostics become more complex, the requirement for higher levels of education and specialized training is likely to continue, potentially putting upward pressure on wages for those who meet these stringent criteria 3, 4. Prospective technologists are encouraged to consult official state-level labor department resources to understand the specific regulatory environment in their jurisdiction, as these laws can directly affect practice scope and salary potential 4, 8.
Sources
- Med Lab Scientist Salary - Medical and Clinical Laboratory Technologist Salary by State (2026)
- Indeed - 31 Highest-Paying States for a Medical Technologist
- Practice Test Geeks - Medical Laboratory Technician Salary 2026 August Guide
- U.S. Bureau of Labor Statistics - Occupational Outlook Handbook: Clinical Laboratory Technologists and Technicians
- VisaFold - H1B Medical Laboratory Scientist Salary 2026
- America By Numbers - Clinical Laboratory Technologists and Technicians Salary in Massachusetts
- Salary By State - Clinical Laboratory Technologists & Technicians Salary in Alaska 2026
- Federal Reserve Bank of St. Louis (FRED) - Median usual weekly nominal earnings for clinical laboratory technologists and technicians
- HealthJob - Medical Lab Tech (MLT) in California Guide
Authored by MyTrendSpot team