Home repair costs across US regions: what to expect
The National Cost Baseline: 2026 Benchmarks
Home repair and improvement spending in the United States continues to shift with labor market conditions, material pricing, and regional economic factors. According to 2026 data compiled across contractor surveys and Bureau of Labor Statistics occupational wage statistics, the average American homeowner spends between $3,200 and $5,800 per year on home services, with individual project costs ranging from $130 for minor work to $175,000 for major structural additions. 1 The median home renovation project costs $2,800 nationally, though the mean is pulled to $6,342 by large structural and addition projects. 2
Key 2026 national project benchmarks provide a starting reference point before regional adjustments are applied. Roof replacement averages $8,500 to $15,000, HVAC system replacement runs $5,000 to $12,000, kitchen remodels span $15,000 to $50,000, and bathroom remodels range from $8,000 to $25,000. 3 Electrical projects represent the most affordable renovation category on average at $1,478, while structural projects such as additions and conversions average $17,767 per project, roughly three times the site-wide mean. 2 Homeowners should treat these figures as national midpoints, not local quotes, since regional multipliers swing costs by 40 to 80% in either direction.
Why Costs Differ So Dramatically Across Regions
Three primary variables drive regional price divergence. Labor is the dominant factor, accounting for 50 to 60% of most project budgets in 2026, up from 40 to 50% in 2020. 4 In high-cost-of-living markets such as San Francisco, New York, Boston, and Seattle, skilled tradespeople earn $60 to $75 per hour, while in lower-cost markets like Memphis, Birmingham, Indianapolis, and Kansas City, the same skills command $35 to $50 per hour. 5 This single variable can effectively double total project cost for labor-intensive work like roofing, electrical panel upgrades, and HVAC replacement.
Material costs add a second layer of regional variation. Lumber prices have stabilized after pandemic volatility, but copper, steel, aluminum mill shapes (up 44.8% cumulatively since 2023), and softwood lumber (up 13.2% year-over-year as of April 2026) remain elevated. 6 Alaska and Hawaii face the steepest material premiums due to shipping logistics. The third factor is regulatory complexity: California, New York, and New Jersey impose strict permitting requirements that add both direct costs (permit fees) and indirect costs through required inspections and code-mandated equipment upgrades. Energy code updates in several states now require higher-efficiency systems, increasing base project costs. 3
Regional Cost Index: Where Each US Area Stands
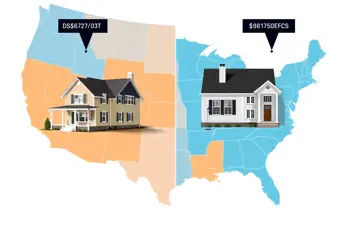
Research using actual project data and BLS wage adjustments shows that home repair costs vary by 40 to 80% across US regions when measured against the national average of 100. The Northeast corridor, covering New York, New Jersey, Connecticut, and Massachusetts, indexes at 120 to 140, driven by high labor rates and strict building codes. The Pacific region, covering California, Washington, and Oregon, indexes at 115 to 135, reflecting seismic construction requirements and elevated cost of living. 3 Union density in construction is identified as the single most explanatory variable for state cost variation: states above 14% union density, including Hawaii at 26.5%, New York at 20.6%, New Jersey at 16.2%, and Massachusetts at 14.6%, show construction wages 25 to 55% above states below 5% union density such as Mississippi, Arkansas, and South Carolina. 6
| Region | Cost Index (National Avg = 100) | Key Driver |
|---|---|---|
| Northeast (NY, NJ, CT, MA) | 120–140 | High labor rates, strict codes |
| Pacific (CA, WA, OR) | 115–135 | Seismic requirements, high cost of living |
| Mountain West (CO, UT, AZ) | 95–110 | Growing demand, moderate labor |
| Southeast (FL, GA, NC, SC) | 85–100 | Lower labor costs, hurricane codes |
| Midwest (OH, IN, MO, KS) | 85–95 | Moderate labor, consistent pricing |
The gap between the least and most expensive US state for home improvement sits at 61%, running from Mississippi at 0.84 times the national average to Hawaii at 1.35 times. 6 A more granular ranking by HavenCostGuide places Hawaii at a 1.55 multiplier and California and New York both at 1.40, while Mississippi sits at a 0.72 multiplier at the low end. 7 For a practical reference, a $40,000 kitchen renovation costs $62,000 in Hawaii and approximately $28,800 in Mississippi under these multipliers.
Project-by-Project Cost Ranges With Regional Context
For the most commonly undertaken projects, 2026 data across multiple contractor surveys and BLS-verified pricing models shows the following national averages, which must then be adjusted by the applicable regional multiplier. Roof replacement carries a national average of $9,800, with a low-cost state (Mississippi) range of $7,056 and a high-cost state (Hawaii) range of $15,484. HVAC replacement averages $7,500 nationally, ranging from $5,400 in low-cost states to $11,850 in high-cost states. 8 Roofing remains the largest single home improvement category by claim volume, with Verisk reporting $31 billion in US roof repair and replacement spending in 2024, up nearly 30% since 2022, with wind and hail driving over 50% of residential claims. 6
| Project | National Average | Low-Cost State (MS) | High-Cost State (HI) |
|---|---|---|---|
| Roof Replacement | $9,800 | $7,056 | $15,484 |
| HVAC Replacement | $7,500 | $5,400 | $11,850 |
| Kitchen Remodel (mid) | $27,000 | $19,440 | $42,660 |
| Bathroom Remodel (mid) | $12,400 | $8,928 | $19,592 |
| Window Replacement (15 units) | $9,000 | $6,480 | $14,220 |
| Deck (300 sq ft) | $7,200 | $5,184 | $11,376 |
| Flooring (1,200 sq ft) | $6,500 | $4,680 | $10,270 |
For plumbing service calls, national average costs run $150 to $450, with the cheapest cities including Memphis, Wichita, Lubbock, Little Rock, and Laredo, while the most expensive markets for the same services include Allentown, Colorado Springs, Virginia Beach, Bakersfield, and Richmond. 9 A plumber in Austin charges $90 to $160 per hour compared to $60 to $100 per hour in Nashville for equivalent work. 10 Emergency and after-hours service across all categories consistently adds 50 to 100% to standard service rates regardless of region. 9
Annual Maintenance Budgeting and Long-Term Cost Realities
Keeping a home in functional condition costs $10,867 per year on average according to research by Zillow and Thumbtack, based on data from millions of home projects completed across the country. 11 The standard budgeting guideline cited by most financial and housing authorities is 1% to 4% of a home's total value annually, with older homes consistently carrying higher maintenance costs because mechanical systems are more likely to require attention or replacement. 12 The median US home is now 44 years old, a factor that structurally increases expected repair frequency and cost for a large portion of the housing stock. 13
A 2026 survey of 1,003 US homeowners found that 94% planned DIY projects, with 39% eyeing major structural work including full remodels, expansions, or significant system overhauls. 14 However, data from renovation outcome tracking indicates that picking the median bid from three to five contractor quotes produces better outcomes than selecting the lowest bid in seven out of ten cases, with the cheapest bid becoming the most expensive option approximately 30% of the time after change orders and rework are factored in. 4 A 15 to 20% contingency budget is consistently recommended across project categories, as hidden problems including water damage, outdated wiring, and structural issues appear in virtually every major renovation. 15
Cost Trends Shaping 2026 Repair Budgets
Renovation costs in 2026 have stabilized after the post-pandemic spike, with materials prices roughly flat year over year, but labor continuing to rise faster than general inflation, especially in electrical, HVAC, and finish carpentry trades. 4 New tariffs on steel, aluminum, lumber, and cabinets pushed material costs 5 to 8% higher versus late 2025, and contractor insurance and bonding costs have risen 15 to 25% since 2023, with those increases passed through to consumers in project quotes. 3 American homeowners spent more than $600 billion on home renovations in 2024 according to the Harvard Joint Center for Housing Studies, 50% higher than pre-pandemic levels, with renovation and repair spending projected to continue at historically elevated rates into 2026. 16
Permit costs added 8 to 18% to project costs in 2025 to 2026 depending on jurisdiction, and unpermitted work creates documented financial consequences at resale, averaging a 15 to 25% price reduction or buyer requirements to retroactively permit the work, while also voiding most insurance coverage on related damage. 4 For homeowners in Sun Belt cities experiencing booming construction activity, contractor availability constraints are keeping prices elevated even in states with lower base labor costs, as crew demand from new construction competes directly with renovation and repair work. 5
Risks, Limitations, and What Regional Data Cannot Predict
Regional and state-level cost indexes provide useful planning benchmarks, but they carry important limitations that homeowners should understand before using them as final budgets. Multipliers reflect metropolitan statistical area averages, meaning rural parts of high-cost states often price closer to neighboring low-cost states, while urban cores within low-cost states can approach mid-tier national pricing. Regional cost multipliers validated against Bureau of Economic Analysis Regional Price Parities show that 48 of 50 states fall within 15% of their BEA equivalent, with Hawaii and Illinois representing the largest deviations due to island logistics and Chicago metro weighting respectively. 6
Hidden structural conditions represent the most significant source of budget overruns that no regional index can anticipate. Sewer line replacement, for instance, starts at $3,300 for short runs but climbs past $12,000 for long, deep, or trenchless runs under driveways, and a routine drain cleaning call can escalate into a full sewer replacement upon camera inspection. 17 Water damage restoration averages $1,200 to $5,000 for initial mitigation but rises substantially based on affected square footage and materials. 18 A reported 76% of homeowners experienced a repair or home-related issue that impacted their finances in the prior year, underscoring that planning around regional averages must always be paired with a financial buffer for discoveries that emerge once work begins. 19
Sources
- Recommended.app Research Team – Home Service Costs Across 50 US Cities 2026 (recommended.app)
- Cost to Renovate Editorial Team – Home Renovation Cost Report 2026 (costtorenovate.com)
- CostSignals – 2026 Home Repair Cost Index: State-by-State Data (costsignals.com)
- Homestery – The 2026 Home Improvement Cost Report (homestery.com)
- Deal Run – Repair Costs Vary by Region: A Guide (dealrun.ai)
- Costorie – 2026 Contractor Pricing Survey: US Home Improvement Costs by Trade and State (costorie.com)
- HavenCostGuide – 2026 Home Renovation Cost Index by State: All 50 States Ranked (havencostguide.com)
- CostPrism – Home Improvement Cost by State 2026: Rankings Across 8 Major Projects (costprism.com)
- ProMatch Now – Home Repair Costs By City: 2026 National Report (promatchnow.com)
- Recommended.app – Plumbing hourly rate city comparison data (recommended.app)
- Zillow and Thumbtack – Average Home Maintenance Cost Per Year, Major Metro Areas (zillow.com)
- ConsumerAffairs – Home Maintenance Costs: A Breakdown 2026 (consumeraffairs.com)
- Seeking Alpha / Wall Street Journal – Aging U.S. Homes Drive Surge in Repair Costs (seekingalpha.com)
- Meck Times – Home Renovation Trends and Forecast 2026 (mecktimes.com)
- Hammerio – Home Renovation Cost 2026: Average Prices by Project Type (hammerio.com)
- ArchBuildHunt – Home Renovation Cost by State 2026 (archbuildhunt.com)
- EstimationPro AI – Sewer Line Replacement Cost: 2026 Contractor Price Guide (estimationpro.ai)
- FindTrustedHelp.com – Home Service Costs by Category 2026 (findtrustedhelp.com)
- Realtor Chris Kew – 6 Surprise Home Repairs and How to Prepare (realtorchriskew.com)
Authored by MyTrendSpot team