Where teachers earn the most: U.S. educator salaries compared by state: A data-based national analysis
Where teachers earn the most is a question answered differently by headline salary, starting pay, and purchasing power. The latest National Education Association data place California, New York, and Washington at the top of average public school teacher salaries, while Mississippi, Florida, and Louisiana occupy the lower end of the comparison. These figures are statewide averages, not guaranteed salaries for every teacher or district. 1
How the national salary benchmark is calculated
The NEA reported an average public school teacher salary of $74,495 for the 2024-25 school year, a nominal increase of 3.5% from $71,985 in 2023-24. The reported national starting teacher salary was $48,112. NEA rankings and estimates combine information collected from state education departments with data from state affiliates and public federal and state datasets. 1
State comparisons use average annual salaries for public school teachers and can include estimates for jurisdictions where final information was not available. The figures describe base salary averages rather than a complete measure of compensation, because pension contributions, health insurance, and other employment benefits differ by state and district. 1
States with the highest average teacher salaries
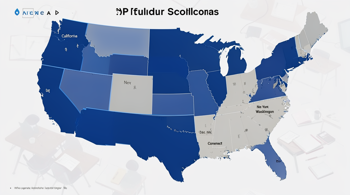
California led the 2024-25 NEA comparison at $103,552, followed by New York at $98,655 and Washington at $96,589. The same broad pattern appears in another 2024 state comparison, which listed California at approximately $101,100, New York at $95,600, Massachusetts at $92,100, and Washington at $91,700. Differences between datasets reflect different reporting years and methodologies. 1 2
| Jurisdiction | Average salary | Comparison note |
|---|---|---|
| California | $103,552 | Highest in the NEA 2024-25 ranking |
| New York | $98,655 | Second-highest in the NEA ranking |
| Washington | $96,589 | Third-highest in the NEA ranking |
| Massachusetts | About $92,100 | Among the highest in the 2024 comparison |
Other jurisdictions commonly associated with higher average pay include Connecticut, New Jersey, Maryland, Illinois, Rhode Island, Alaska, Oregon, and Pennsylvania. High statewide averages often reflect established salary schedules, higher local labor costs, and large metropolitan districts, so the statewide number should not be interpreted as a uniform offer across every community. 2 7
States at the lower end of the salary ranking
Mississippi reported the lowest average salary in the NEA data at $54,975, followed by Florida at $56,663 and Louisiana at $56,785. The gap between California and Mississippi was therefore $48,577 in the cited school year. NPR also identified these three states as the low end of the 2024-25 ranking. 1 3
Lower average salaries are concentrated in several Southern and rural states, although regional averages do not explain every district. Other comparisons identify West Virginia, South Dakota, and additional Southern states as jurisdictions where mean wages are often below those in the Northeast and West Coast. State funding formulas, local tax bases, labor markets, and collective bargaining structures all influence the salary schedule available to teachers. 6 7
Starting pay differs from the statewide average
A high average salary does not necessarily mean a new teacher begins near that level. In a 2024 comparison, reported starting salaries included $58,409 in California, $50,077 in New York, $52,616 in Massachusetts, $57,912 in Washington, and $63,373 in the District of Columbia. The figures show how experience-based salary schedules can produce a substantial spread between entry-level and average pay. 2
Starting salaries also vary among states that have similar average salaries. The comparison listed Utah at $55,711, New Mexico at $53,400, and Texas at $48,526, while Nebraska was listed at $38,811. Credentials, years of experience, advanced degrees, subject area, and district placement can affect an individual salary, making statewide averages an incomplete guide for career planning. 2 7
Why cost of living changes the interpretation
Nominal salary rankings do not adjust for housing, transportation, taxes, or other local expenses. California, New York, Washington, Massachusetts, and Connecticut are among the jurisdictions with high teacher salaries, but they also contain expensive housing markets and high-cost metropolitan areas. A larger paycheck can therefore have less purchasing power than the headline amount suggests. 3 4
Governing reported that average teacher pay in every state fell short of a standard intended to cover living costs while leaving at least 20% for saving or debt repayment. That finding does not mean every teacher faces the same financial outcome, because housing choices, commuting distances, household income, and district location vary. It does show why salary comparisons should be paired with cost-of-living analysis. 6
Collective bargaining, benefits, and pay trends
The NEA reported that teachers earn 24% more on average in states with collective bargaining rights. It also found that the average salary increase from 2023-24 to 2024-25 was 3.5%, with the largest one-year increases occurring in Nevada at 11.8%, the District of Columbia at 9.7%, and Delaware at 7.6%. These changes describe averages and do not establish the terms of any individual contract. 1
Inflation remains a central limitation on interpreting nominal raises. Education Week reported that the national average salary rose from $71,985 to $74,495, while the NEA estimated a 4.6% decline over the prior decade after inflation adjustment. Benefits, pension funding, contract length, class size, administrative workload, and certification requirements also affect the practical value and sustainability of educator employment. 4
How to read a state salary comparison responsibly
The most useful comparison separates at least four measures: average salary, starting salary, inflation-adjusted change, and local purchasing power. It also distinguishes public school averages from private-school pay or federal wage data. A state with a high average can contain districts with very different salary schedules, while a lower-paying state may include particular districts with stronger compensation than the statewide figure indicates. 2 7
Salary data should be treated as historical or estimated benchmarks rather than active employment listings. The NEA’s annual rankings provide a consistent basis for state comparisons, but estimates, reporting years, district conditions, and benefit structures create meaningful uncertainty. The evidence supports a clear conclusion: teachers generally earn the highest nominal salaries in California, New York, Washington, Massachusetts, Connecticut, New Jersey, Maryland, and nearby high-cost jurisdictions, but the highest gross pay does not automatically produce the strongest financial position. 1 2
Sources
- National Education Association, Educator Pay Data 2026 and Teacher Pay & Per Student Spending
- World Population Review, Teacher Pay by State 2026
- NPR, Inflation is sucking the life out of teacher pay raises, report says
- Education Week, Increases in Teacher Pay Offset by Inflation, Union Analysis Shows
- Business Insider, Here’s How Much Teachers Get Paid in Every US State
- Governing, Map: Which States Pay Teachers the Most?
- k12.careers, Teacher Salary by State in 2026
Authored by MyTrendSpot team