Nursing pay by state: which regions offer the highest salaries
Geography is one of the most consequential variables in a nursing career's financial equation. According to Bureau of Labor Statistics Occupational Employment and Wage Statistics (OEWS) data, the national median annual wage for registered nurses reached $97,550 as of May 2025, with a mean annual wage of $101,420 1. Yet that single national figure conceals a range that stretches from roughly $62,000 in the lowest-paying states to more than $150,000 in California, a spread of nearly $90,000 for the same license and comparable responsibilities 2. Understanding where that variation originates, and what it means after taxes and housing costs, is essential context for any nurse evaluating career geography.
The National Salary Baseline and Growth Trajectory
Registered nursing has experienced consistent wage growth over the past several years. BLS OEWS actual data shows the national median climbed from $73,300 in 2019 to $93,600 in 2024 and $97,550 in 2025, representing a compound annual growth rate of approximately 5.31% 3. The mean annual wage of $101,420 is pulled above the median by high-earning states concentrated along the coasts. Approximately 3,379,720 registered nurses are employed nationwide, making it the largest healthcare practitioner occupation in the country 4. The BLS projects 5% employment growth from 2024 to 2034, generating approximately 189,100 job openings per year, driven by retirements and an ongoing staffing shortage rather than purely new demand 4.
Nursing wages grew 27% from 2019 to 2024 in nominal terms, moving from a national mean of $77,460 to $98,430 5. Year-over-year growth from May 2023 to May 2024 was approximately 4.2%, outpacing headline consumer price inflation for the same period 6. The U.S. faces an estimated 8% RN shortage, equivalent to roughly 263,870 vacancies in 2026 according to HRSA projections, a structural deficit that exerts continued upward pressure on wages in high-demand markets 6.
Top-Paying States for Registered Nurses
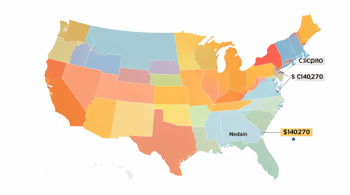
Pacific Coast states dominate the upper tier of nursing compensation by a substantial margin. According to BLS OEWS May 2025 data, California leads all states with a mean annual wage of $150,280 and a median of $140,270 7. Hawaii follows at a mean of $124,340 and median of $136,320, Oregon at $123,140 mean and $129,010 median, and Washington at $121,540 mean and $124,200 median 7. Alaska, at a mean of $114,870, rounds out the Pacific premium group before Northeast states enter the ranking 7.
The Northeast cluster is anchored by Massachusetts ($117,960 mean), New York ($113,440 mean), New Jersey ($110,100 mean), and Connecticut 7. The table below summarizes the top ten states by median registered nurse salary from BLS OEWS May 2025 data.
| Rank | State | Median RN Salary | Mean RN Salary |
|---|---|---|---|
| 1 | California | $140,270 | $150,280 |
| 2 | Hawaii | $136,320 | $124,340 |
| 3 | Oregon | $129,010 | $123,140 |
| 4 | Washington | $124,200 | $121,540 |
| 5 | Alaska | $109,480 | $114,870 |
| 6 | New York | $109,440 | $113,440 |
| 7 | New Jersey | $106,500 | $110,100 |
| 8 | Massachusetts | $104,550 | $117,960 |
| 9 | Nevada | $103,670 | N/A |
| 10 | Connecticut | $102,740 | N/A |
Why Pacific States Lead: Structural Drivers of High Wages
California's dominance is not accidental. Three structural forces converge to produce wage levels significantly above all other states. First, California enforces legally mandated nurse-to-patient ratios under Assembly Bill 394, requiring hospitals to maintain a 1:5 ratio in medical-surgical settings and 1:2 in intensive care units 8. Facilities that cannot fill those ratios with permanent staff turn to travel and contract nurses, intensifying competition for labor and driving up base compensation. Second, union density is high, with the California Nurses Association and National Nurses United maintaining collective bargaining agreements that establish wage floors and progression scales across major hospital systems 8. Third, housing costs in major California metros exceed $3,200 per month for a one-bedroom apartment, creating a wage-floor effect where employers must pay enough to allow nurses to live within commuting distance of the facility 9.
The Pacific Northwest mirrors this pattern at a somewhat lower scale. Washington state travel nurses regularly earn between $2,500 and $3,800 per week in total package value, with Oregon tracking closely behind, both states benefiting from strong hospital systems competing for qualified staff 10. Alaska's high wages reflect geographic isolation and the recruitment challenges of serving remote populations, factors that function as a structural wage premium independent of union contracts or staffing ratio legislation 1.
Lowest-Paying Regions and the Southern Compensation Gap
Southern and interior states occupy the bottom of the national wage distribution by a wide margin. South Dakota historically ranks last for RN pay at approximately $69,510 nominal, though it has the highest RN density in the country at 16 registered nurses per 1,000 residents 1. Mississippi sits at roughly $62,000 to $64,400, representing a gap of nearly $90,000 versus California for the same credential 2. Alabama, Arkansas, Oklahoma, Louisiana, and West Virginia consistently appear in the bottom ten, with average RN salaries in the $61,000 to $68,000 range 11.
The geographic concentration of low-paying states is not random. The absence of statewide staffing ratio mandates, lower union penetration, lower average cost of living, and lower population density all suppress wage floors in the South and parts of the Midwest. Illinois ranks 18th nationally at approximately $76,200, meaning nurses there earn roughly $18,650 less annually than counterparts in Massachusetts despite equivalent educational requirements and licensing standards 12. Ohio trails further at around $72,300, a differential that compounds significantly across a multi-decade career 12.
Cost-of-Living Adjustment: When High Salaries Lose Their Premium
Nominal salary rankings shift substantially when purchasing power adjustments are applied. SmartAsset's 2026 study, which adjusted median RN earnings for regional cost-of-living differences, found that Pacific states retain their lead even after accounting for West Coast housing and expense premiums, with California, Hawaii, Oregon, Alaska, and Washington occupying the top five positions on a cost-adjusted basis 1. However, within that adjusted ranking, Oregon outperforms California on an hourly purchasing power basis, with cost-of-living-adjusted rates of $51.71 per hour for Oregon versus $49.25 for California 13.
States with moderate nominal salaries and low cost of living can deliver stronger real purchasing power than their headline figures suggest. A nurse earning $83,500 in Houston, where no state income tax applies and the cost-of-living index sits near 103, retains more practical purchasing power than a nurse earning $96,000 in Boston after accounting for Massachusetts income tax and housing costs 14. Nevada benefits from no state income tax alongside a median RN salary above $103,000, a combination that strengthens its effective compensation position relative to similarly compensated states with progressive income tax structures. Union nurses across all states earn an estimated 18.8% more than non-union counterparts, a premium that compounds the geographic variation already present in base wages 6.
Salary by Nursing Role and Specialty
The pay gap between nursing credential levels is as significant as any geographic differential. According to BLS OEWS May 2025 data, nursing assistants average $42,700 annually at the base of the career ladder, licensed practical nurses earn approximately $67,050, staff registered nurses $101,420, certified nurse midwives $136,980, nurse practitioners $137,300, and certified registered nurse anesthetists $248,320 13. The progression from CNA to CRNA represents a 482% salary increase, while the step from staff RN to nurse practitioner adds approximately $37,000 per year in national average terms 13.
Specialty within the RN tier also produces meaningful wage differentiation. Critical care and ICU nurses average $89,750 annually with shift differentials adding 15 to 20% to base pay, emergency department nurses average $88,950, oncology nurses approximately $87,300, and medical-surgical nurses $79,850 at the general baseline 15. Nurse practitioners in rural states command a specific premium driven by scope of practice: New Mexico, Iowa, Oklahoma, and Alaska rank among the top states for NP earnings because nearly half of all rural primary care practices employ at least one NP, creating concentrated demand with limited local supply 1. NP employment growth is projected at 40% from 2024 to 2034, ranking third fastest among all occupations in the U.S. economy 13.
What Nurses Should Evaluate Beyond State Salary Rankings
Raw state salary rankings are a useful starting point but an incomplete decision framework. Several factors alter the practical value of any headline figure. State income tax structure matters significantly: Washington state's median RN salary of $124,200 carries no state income tax burden, while a comparable salary in a high-tax state reduces take-home pay by several thousand dollars annually 3. Shift differentials, overtime availability, on-call requirements, and weekend pay expectations can add 15 to 25% to base compensation in high-acuity hospital settings, a differential that rarely appears in state-level salary summaries. A survey from Nurse.org in 2026 found that 93% of nurses reported their pay was not keeping pace with their professional expectations, reflecting a gap between published averages and lived compensation experience 16.
Experience trajectory also reshapes the geographic calculus. Nurses with 10 or more years of experience typically earn 40 to 60% more than new graduates in the same role, meaning the long-term return of a given state's compensation structure depends heavily on how consistently wages scale with tenure 17. BSN-credentialed nurses earn approximately $6,000 to $10,000 more per year than ADN nurses in comparable roles, a premium that compounds across states with structured clinical ladder programs 2. Nurses evaluating geographic moves are well-served by examining cost-of-living-adjusted salary, state tax exposure, union contract availability, staffing ratio protections, and specialty premium structures alongside the published state median before drawing conclusions about which region genuinely offers the strongest financial position.
Sources
- SmartAsset / Stacker - Where It Pays to Be in Nursing: 2026 Study (smartasset.com)
- NurseSalaryIntel - Nurse Salary Data 2026: All 50 States and Specialties (nursesalaryintel.com)
- RNWages - Registered Nurse Salary by State 2026, BLS OEWS Data (rnwages.com)
- OpenExamPrep - Registered Nurse Salary by State and Specialty 2026 (open-exam-prep.com)
- University of West Alabama Online / UWA - Highest-Paid Nurses by City and State (online.uwa.edu)
- Salario.io - Nurse Salary by State 2026: How Much Do RNs Really Make? (salario.io)
- Mappr.co - Registered Nurse Salary by State 2025, Mapped and Ranked (mappr.co)
- Ava Health - RN Salary by State 2026, Top-Paying States and Specialty (providers.avahealth.co)
- NurseSalaryData - Nurse Salary by State 2026, Highest Paying States (nursesalarydata.com)
- World Business Outlook - Which States Pay Travel Nurses the Most in 2026 (worldbusinessoutlook.com)
- Wealthvieu - Registered Nurse Salary 2026: By State, Specialty, and Experience (wealthvieu.com)
- NurseSalaryData - Registered Nurse Salary by State 2026 (nursesalarydata.com)
- The Nursing Directory - Nursing Salary and Career Data 2026 (thenursingdirectory.com)
- NurseSalaryIntel - Nurse Salary Cost of Living 2026: Where $89K Goes Furthest (nursesalaryintel.com)
- NurseSalaryData - Nursing Salary Statistics 2026: 50+ Key Facts (nursesalarydata.com)
- Nurse.org - 93% of Nurses Say Their Pay Isn't Keeping Up: Salary Survey 2026 Results (nurse.org)
- NurseLicenseGuide - Nursing Salary by State 2026 (nurselicenseguide.com)
Authored by MyTrendSpot team