What to know about the regional variation in senior care fees: A data-focused reporting guide for families and planners
What to know about the regional variation in senior care fees: This reporting guide draws directly from published 2026 medians and state-by-state benchmarks that show how the same care setting can cost meaningfully different amounts depending on location, licensing definitions, labor conditions, and market supply.
1) Start with benchmarks by care setting, not one national number
National “medians” provide an anchor, but they do not replace state and regional pricing. One compiled 2026 snapshot reports assisted living at about $6,200 per month and semi-private nursing home rooms at about $9,581 per month, alongside private-room nursing home medians around $10,798 per month. In-home care for a non-medical caregiver is shown as about $35 per hour, while adult day health care is shown at about $95 per day. These figures describe medians across the U.S., not what any specific community charges in a specific zip code. 1
Even within the same broader category, care intensity and the “bundle” of services included in base pricing can shift effective monthly cost. A pricing guide anchored in 2025 move-in data cites median paid costs rather than advertised starting rates, listing independent living around $3,200 per month, assisted living around $5,419 per month, and memory care around $6,690 per month. That distinction matters when comparing states, because some quotes may separate add-ons from the base rate while others embed more services into a single line item. 7
| Care setting (benchmark) | Published national median shown | Unit |
|---|---|---|
| Assisted living | About $6,200 | Per month (2026 snapshot) 1 |
| Nursing home, semi-private room | About $9,581 | Per month (2026 snapshot) 1 |
| Nursing home, private room | About $10,798 | Per month (2026 snapshot) 1 |
| In-home care (non-medical) | About $35 | Per hour (2026 snapshot) 1 |
| Adult day health care | About $95 | Per day (2026 snapshot) 1 |
2) Assisted living can swing sharply by state due to licensing and Medicaid rules
Assisted living prices can vary widely across states, and the variation is partly explained by differences in how settings are defined and regulated. A state-by-state assisted living overview grounded in CareScout 2025 cost survey results reports a national median near $6,200 per month, while examples show Georgia at about $5,300 per month and Hawaii at about $12,096 per month. The same source emphasizes that the label and licensing framework may change from one state to another, influencing which services a base rate includes. 2
Medicaid coverage for assisted living and how it is delivered also varies by state. In practical budgeting, the question is not only “what is the private-pay monthly rate,” but also whether any state program contributes to that rate for a given person’s circumstances. The research context also notes that eligibility rules and provider payment arrangements can shift effective costs to families across regions, even when the care setting appears to be the same. 3
What to verify in an assisted living quote
- What the community includes in its base monthly rate (for example, medication help vs help with activities of daily living). 3
- Whether the quote is for a one-bedroom unit or another housing type that may alter the pricing tier. 7
- Any state-specific Medicaid or waiver linkage described by the community or listed in documentation. 3
3) Nursing home fees show some of the widest state spreads
Nursing home costs reflect the combined effect of round-the-clock skilled care, staffing availability, and regional pricing structures. One 2026 state-focused summary reports semiprivate rooms ranging from $5,808 per month in Texas to $32,220 per month in Alaska, and private rooms ranging from $7,519 in Texas to $32,220 in Alaska. Those extremes illustrate why families planning for long-term placement cannot rely on a single national average. The same source reports national medians near $9,842 per month for semiprivate and $11,294 per month for private in June 2026. 3
Another 2026 nursing home planning context uses a “private pay” daily cost perspective and reports a nationwide average daily cost for a shared room of about $327, with an average annual cost of about $119,340. It also states that the range extends from about $190 per day in parts of Texas and Louisiana to over $1,000 per day in Alaska, and that the table covers 400-plus geographic areas across 50 states and Washington, DC. For families comparing states, this reinforces the need to treat geographic location as a primary cost driver. 4
Federal insurance coverage friction points families encounter
Medicare and Medicaid can change what a payer ultimately owes, but they do not make costs uniform across regions. Medicare generally does not cover long-term custodial care, which is ongoing assistance with activities of daily living, regardless of location. 5 In addition, a Medicare coverage note describes that Medicare does not pay for most long-term care needs like ongoing custodial care, pushing more of the long-term financial responsibility to families or Medicaid when eligibility is met. 6
Because Medicaid eligibility criteria and benefit delivery are administered at the state level, state policies can affect whether a person qualifies, what a state pays a facility, and what personal expenses remain. 3 This is one reason “same care type, different state” can translate into different out-of-pocket burdens even before comparing individual community pricing. 3
4) Home care and adult day care vary by region, sometimes by zip-level market structure
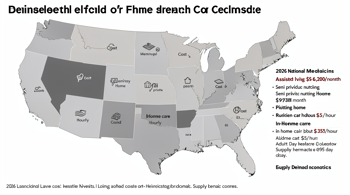
In-home care pricing varies by region and market conditions. A compiled 2026 snapshot reports a national median of about $35 per hour for a non-medical caregiver and a state range from about $25 per hour in Mississippi to $44 per hour in South Dakota. It also distinguishes non-medical caregiver work from skilled nursing delivered at home, which is described as substantially more expensive, with an example rate around $90 per hour for private duty nursing. 8
Cost differences can also appear at finer geographic resolution. A home care research analysis focused on concentrated agency markets reports that zip codes separated by as little as 2 miles can show hourly rate differences of $34 or more in a 2026 analysis across 12 metropolitan statistical areas. It frames the pattern as related to how agency markets cluster and how prices can be affected by market structure rather than by identical service descriptions. For budgeting, this means regional averages may not reflect what a family receives from local agencies. 9
Adult day health care benchmarks and regional implications
A 2026 benchmark snapshot lists adult day health care at about $95 per day. 1 While published national medians help with initial planning, the same logic applied to in-home care applies to adult day services: local staffing costs, demand levels, and availability can shift what “the same day of care” costs across neighborhoods and states. 3
5) Why the same care can cost multiples: labor markets, housing costs, and supply constraints
Regional variation is frequently described as an interaction of labor costs, real estate markets, regulatory conditions, and local supply-demand balance. A news report referencing proprietary cost data attributed cross-state differences in long-term care and senior living expenses to variations in labor costs, real estate markets, regulatory conditions, and local supply-demand balance. 5 The same type of explanation is reflected across the research context, which identifies local wages, housing costs, and availability of care providers as major drivers. 10
Assisted living guidance also explicitly connects cost to staffing and market conditions. A National Center for Assisted Living reference emphasizes that assisted living costs are influenced by staffing needs and regional market conditions, reinforcing the idea that fee differences are not limited to rent. 10 For families, this matters because a quote that seems higher may be reflecting a different staff-to-resident mix, building economics, or procurement capacity rather than a different “level of care” on paper. 10
Example of state extremes and why planning buffers are necessary
A state-by-state nursing home cost summary shows semiprivate rooms ranging up dramatically across states, including Texas at $5,808 per month and Alaska at $32,220 per month. 3 An assisted living overview similarly shows Hawaii at about $12,096 per month versus Georgia at about $5,300 per month. 2 These ranges indicate that cost planning buffers cannot be generic if the placement is flexible across geography or if relocation is being considered. 2
6) A 360-degree view: regulatory oversight, eligibility criteria, and what “cost” can mean
“Senior care fees” can mean different things depending on whether the pricing reflects private pay, council or state rates, or Medicaid-eligible placements. Even within the U.S. dataset context, some sources describe “private pay” averages and specify that Medicaid often pays different amounts, while families face different personal spending requirements. 4 In planning terms, that distinction changes both the monthly number and the time horizon for spend-down or eligibility pathways. 4
Health insurance coverage can also create friction between “need” and “coverage.” Medicare generally does not cover ongoing custodial long-term care, which affects family budgets regardless of region. 5 At the same time, Medicaid eligibility criteria require limited income and assets and involve a personal needs allowance structure that channels much of the remaining income toward nursing home costs. 4 Because Medicaid administration is state-based, the same care need can translate into different financial outcomes by location. 3
Practical checklist for comparing regional quotes
- Confirm the room type, such as semi-private versus private, because published medians differ by room configuration. 1
- Confirm the care definition used in the pricing, including whether the base rate includes medication help or only personal care support. 2
- Ask how the quote changes with additional care levels and whether any add-on services are billed separately. 1
- Document coverage assumptions separately from sticker prices, especially when Medicare is not expected to cover long-term custodial needs. 5
Sources
- Brevy Care: Cost of Senior Care by State (2026): All Four Settings https://brevy.com/care-types/cost-of-senior-care-by-state
- Brevy Care: Assisted Living by State: Costs, Rules and Medicaid Coverage https://brevy.com/care-types/assisted-living-by-state
- SeniorLiving.org: Nursing Home Costs in 2026 by State and Type of Care https://www.seniorliving.org/nursing-homes/costs/
- MedicaidPlanningAssistance.org: 2026 Nursing Home Costs by State and Region https://www.medicaidplanningassistance.org/nursing-home-costs/
- Newsweek: Map shows states with the highest senior care costs https://www.newsweek.com/map-shows-states-highest-senior-care-costs-11549261
- Medicare.gov: Coverage for long-term care https://www.medicare.gov/coverage/coverage-for-long-term-care
- Budget Seniors: Cost of Senior Living Communities https://www.budgetseniors.com/benefits-finance/cost-of-senior-living-communities/
- Raya’s Paradise: In-Home Senior Care Costs by State 2026 https://rayasparadise.com/research/in-home-senior-care-cost
- CareCost: Home care costs will vary wildly by zip code in 2026 https://carecost.cc/home-care-costs-will-vary-wildly-by-zip-code-in-2026
- General research context (LLM-gathered): Regional cost drivers including labor markets, housing costs, and care availability
- AARP: Medicare coverage and what it does not cover https://www.aarp.org/health/medicare-insurance/info-2022/what-medicare-covers-and-what-it-doesnt.html
- NCAL context (LLM-gathered): National Center for Assisted Living factors influencing assisted living costs https://www.ahcancal.org/Newsroom/PressReleases/Pages/Facts-About-Assisted-Living.aspx
Authored by MyTrendSpot team