Food Manufacturing Worker Average Annual Salary by State: An Analysis of National Compensation Trends
The food manufacturing sector, classified under NAICS 311, serves as a cornerstone of the U.S. economy, transforming raw agricultural commodities into essential consumer products 2. As of 2026, the national median salary for food processing workers is approximately $38,000 per year, which equates to an hourly rate of $18.47 1. Compensation within this sector is subject to significant regional fluctuations influenced by local labor market demands, the concentration of large-scale facilities, and varying cost-of-living indices across the fifty states 14.
National Compensation Landscape
Data indicates that entry-level positions in food processing often commence around $30,000 annually, while those in the 90th percentile of the workforce can earn up to $47,000 per year 1. The broader food manufacturing industry, which employs over 1.7 million workers across roughly 36,000 establishments, reports an average annual wage of $55,880 when considering the entire spectrum of manufacturing roles, including specialized technical and administrative positions 2. This distinction is critical for understanding why generalized industry averages often appear higher than specific labor-focused wage reports 3.
Regional Wage Variations
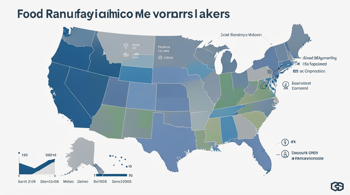
State-level data reveals that geographic location plays a pivotal role in determining annual pay for production-line staff. Kansas and Nebraska currently lead the nation in median salaries for food processing workers, both reporting averages of $45,000 per year 1. These figures represent an 18% increase over the national median, suggesting that states with heavy concentrations of meat processing and grain milling may prioritize competitive wages to maintain workforce stability 12. Conversely, many states exhibit median earnings that hover near the national $38,000 benchmark, reflecting a balanced distribution of labor demand in regions like Michigan, Florida, and California 1.
| Rank | State | Median Annual Salary | vs. National |
|---|---|---|---|
| 1 | Kansas | $45,000 | +18% |
| 2 | Nebraska | $45,000 | +18% |
| 3 | Idaho | $44,000 | +16% |
| 4 | Massachusetts | $44,000 | +16% |
| 5 | North Dakota | $44,000 | +16% |
| 6 | Washington | $43,000 | +13% |
| 7 | Wisconsin | $43,000 | +13% |
| 8 | Wyoming | $43,000 | +13% |
| 9 | New Hampshire | $42,000 | +11% |
| 10 | Tennessee | $42,000 | +11% |
Specialized Roles and Compensation
Within the food manufacturing umbrella, specific roles such as roasting, baking, and drying machine operators command higher compensation due to the specialized nature of the equipment and safety training involved 6. The national median for these specific operators stands at $43,000 per year, or $20.54 per hour 6. Top earners in these categories, particularly in states like Colorado, have been reported to reach annual earnings of up to $60,000, illustrating that technical proficiency is a primary driver of wage growth beyond the entry-level baseline 6.
Economic Factors Influencing Payroll
Manufacturing payroll data provides a comprehensive view of industrial activity, with U.S. manufacturers paying more than $851.3 billion in annual payroll across 12.19 million workers in the broader manufacturing sector 4. While total payroll is a high-level metric, the average annual pay per worker across all manufacturing subsectors is approximately $69,847 4. Factors such as hazard pay, shift differentials for night or weekend operations, and robust overtime opportunities in meatpacking and beverage production frequently elevate actual take-home pay above the reported base median salary 78.
Regulatory and Structural Impacts
Regulatory frameworks, such as the Food Safety Modernization Act (FSMA) enforced by the FDA, require strict hazard analysis and preventive controls, which necessitate a more skilled and trained workforce 2. This regulatory environment influences hiring practices and salary structures as employers seek candidates capable of maintaining high compliance standards 2. Furthermore, industrial concentration-where a few large firms control the majority of processing capacity-often dictates regional wage floors, as these organizations possess the capital to standardize compensation packages across their various plant locations 2.
Future Market Outlook
The growth rate for food processing positions is currently projected at 0% for the 2022-2032 period, suggesting a stable but non-expanding workforce in terms of raw headcount 16. However, wage growth remains dynamic, with some states experiencing significant year-over-year increases in hourly earnings due to labor market tightness 7. As automation continues to integrate into food production lines, the nature of the labor demand is shifting toward technical maintenance and system operation, which is likely to continue influencing salary trends upward for those who possess the requisite mechanical or digital skill sets 10.
Sources
- SalaryByState.com, Food Processing Workers Salary 2026
- VantaInsights, Food Manufacturing NAICS 311 Industry Report
- Manufacturing Lead Generation, Manufacturing Salary Statistics 2026
- Manufacturing Lead Generation, Manufacturing Payroll by State 2026
- Manufacturing Lead Generation, Manufacturing Employment by State 2026
- SalaryByState.com, Food & Tobacco Roasting, Baking & Drying Machine Operators Salary 2026
- Manufacturing Lead Generation, Manufacturing Hourly Earnings by State 2026
- Salario.io, US Salary Statistics 2026
- AmericaByNumbers, Salary by Industry 2025
- CareerExplorer, Industry Trends and Career Outlook
Authored by MyTrendSpot team